Global Sales and Supply Chain Analytics
An end-to-end analytics solution designed to transform global sales and supply chain data into actionable business insights.
The project combines Excel, Python, Pandas, SQL, Snowflake and Power BI to analyze sales performance, profitability, customer behavior, market performance, delivery efficiency and supply chain operations.

Project Overview
The global sales dataset contains 180,519 transaction records. The project follows a complete analytics workflow from raw data preparation and transformation to SQL analysis, cloud data warehousing and interactive Power BI dashboards.
Analytics Areas
Sales Performance
Analyzed overall sales performance, revenue trends, product performance and business growth patterns.
Profitability
Evaluated total profit, profit margins and profitability across products, customers and markets.
Customer & Market
Identified customer-level and market-level performance drivers and business opportunities.
Delivery & Supply Chain
Examined shipping time, delivery delays, on-time performance and supply chain efficiency.
Power BI Dashboards
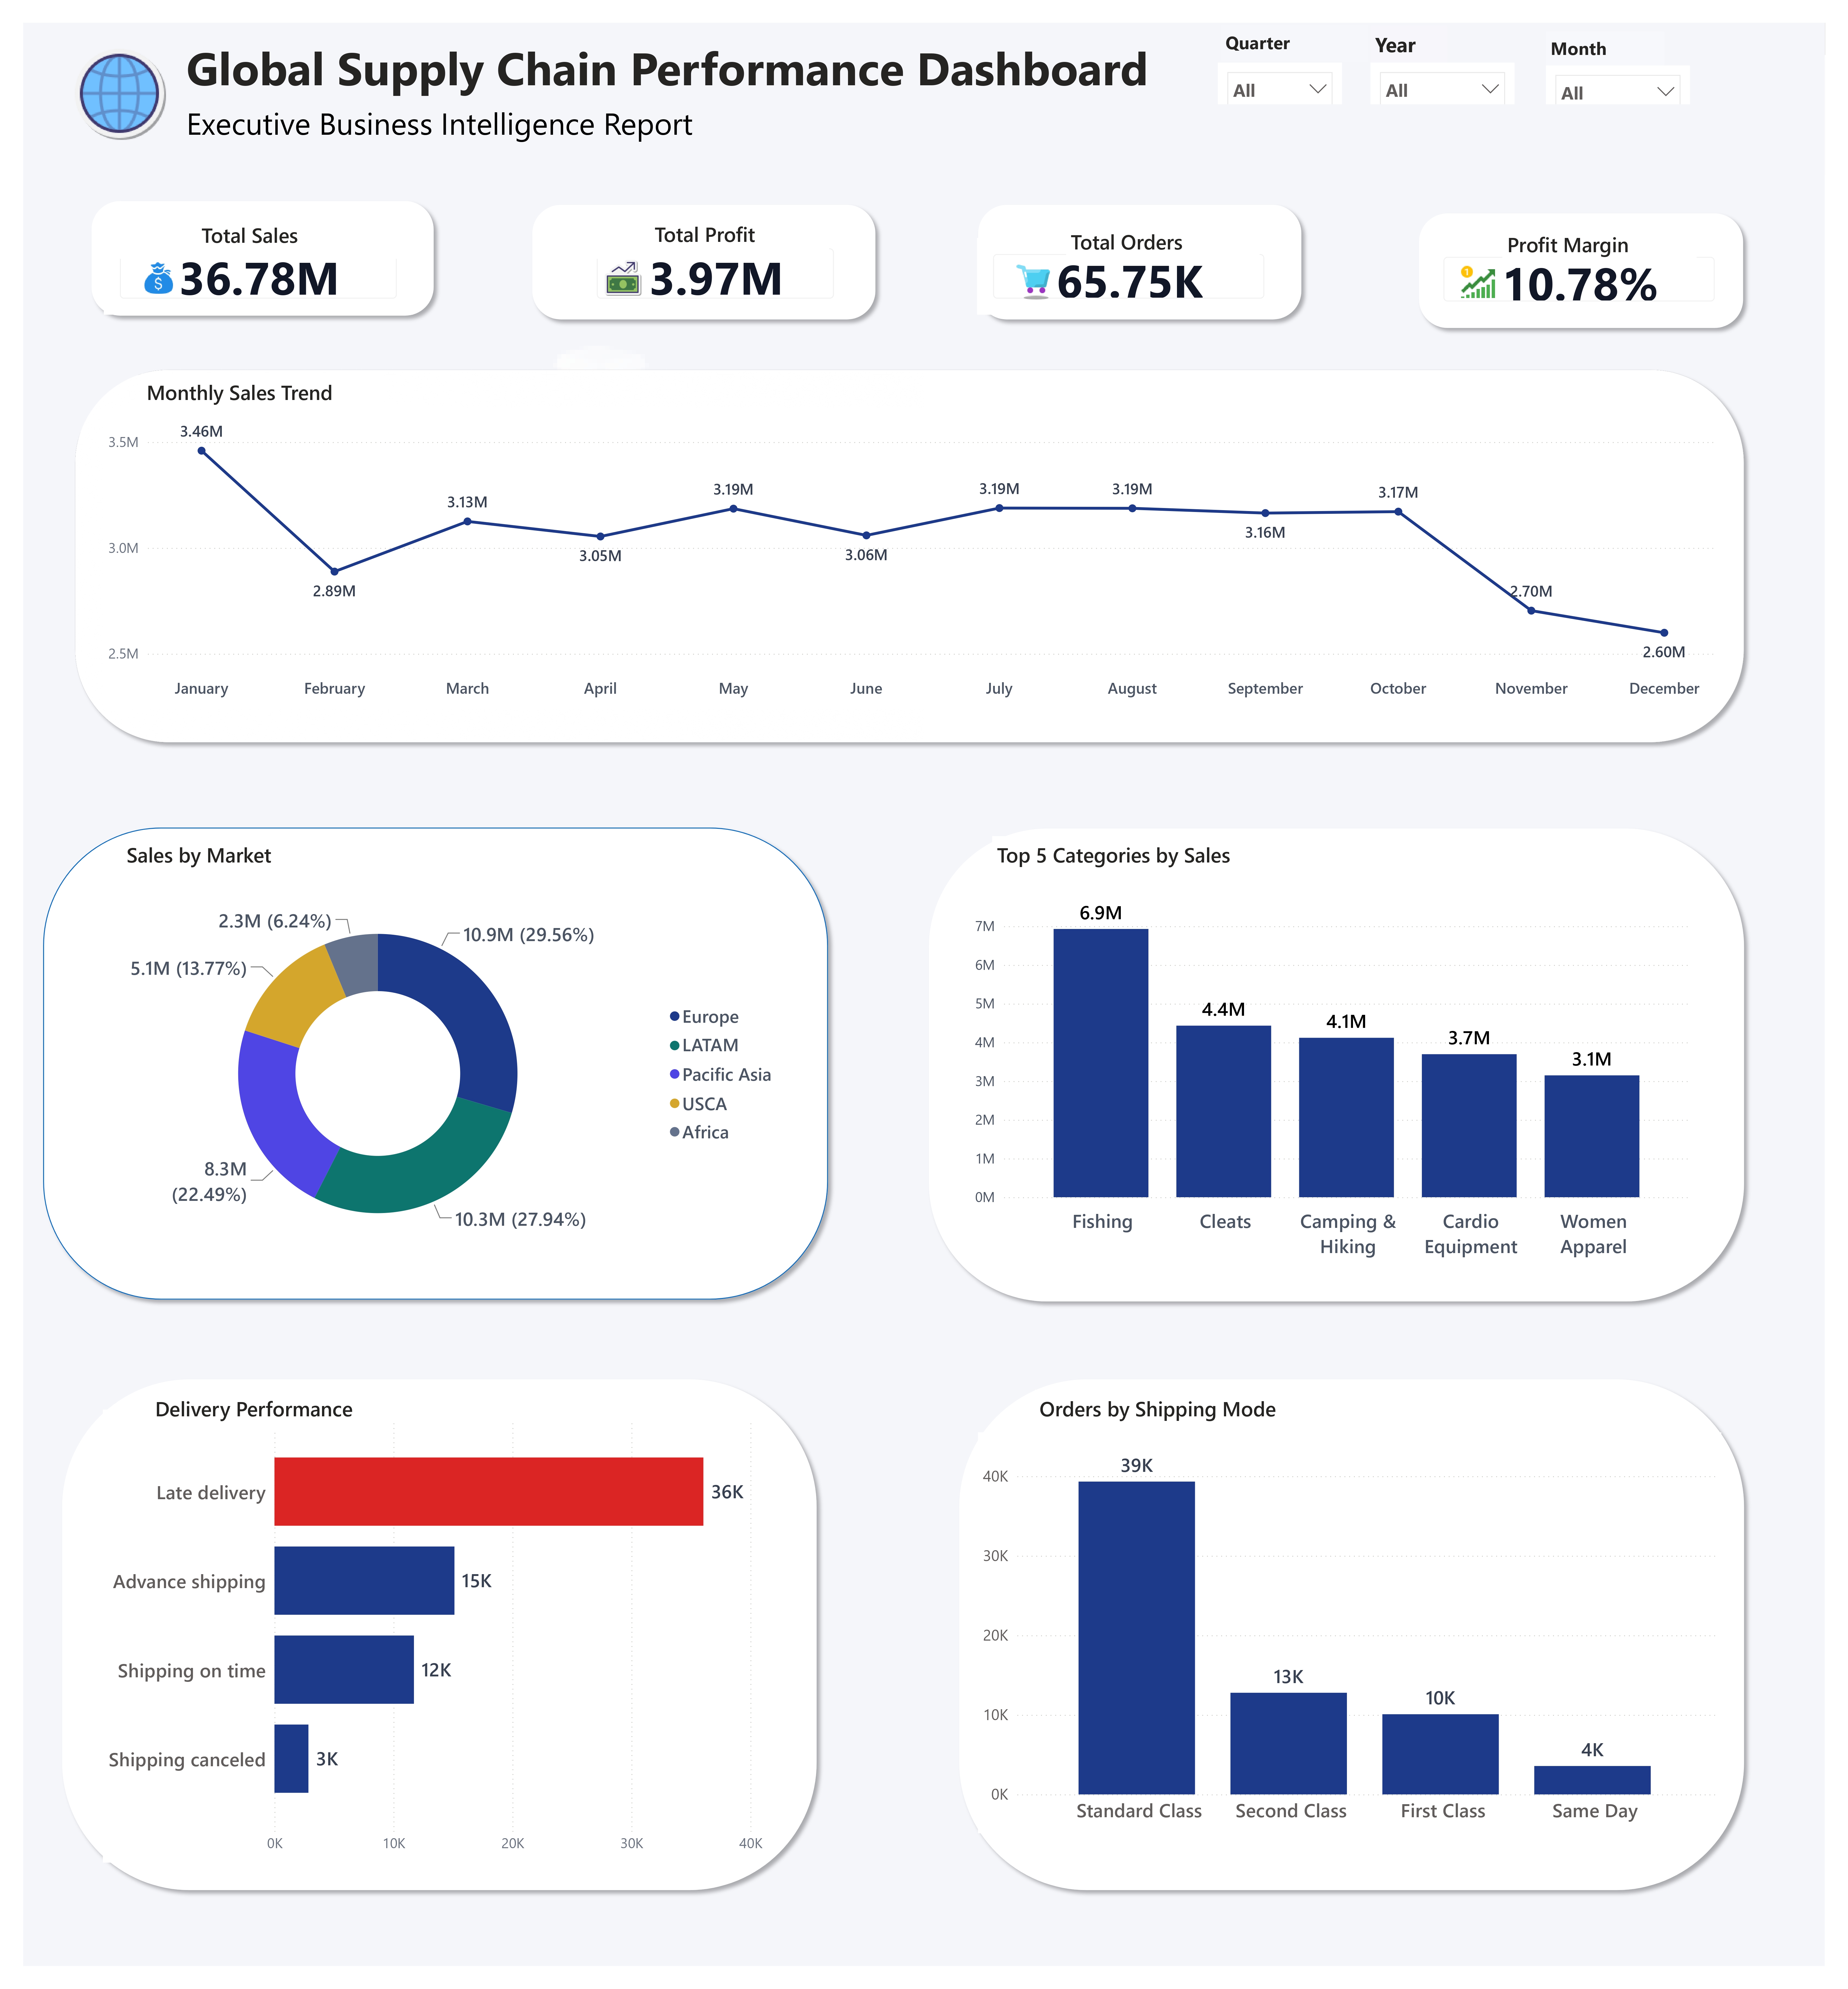
01 — Global Supply Chain Performance Dashboard
02 — Sales & Profit Analysis Dashboard
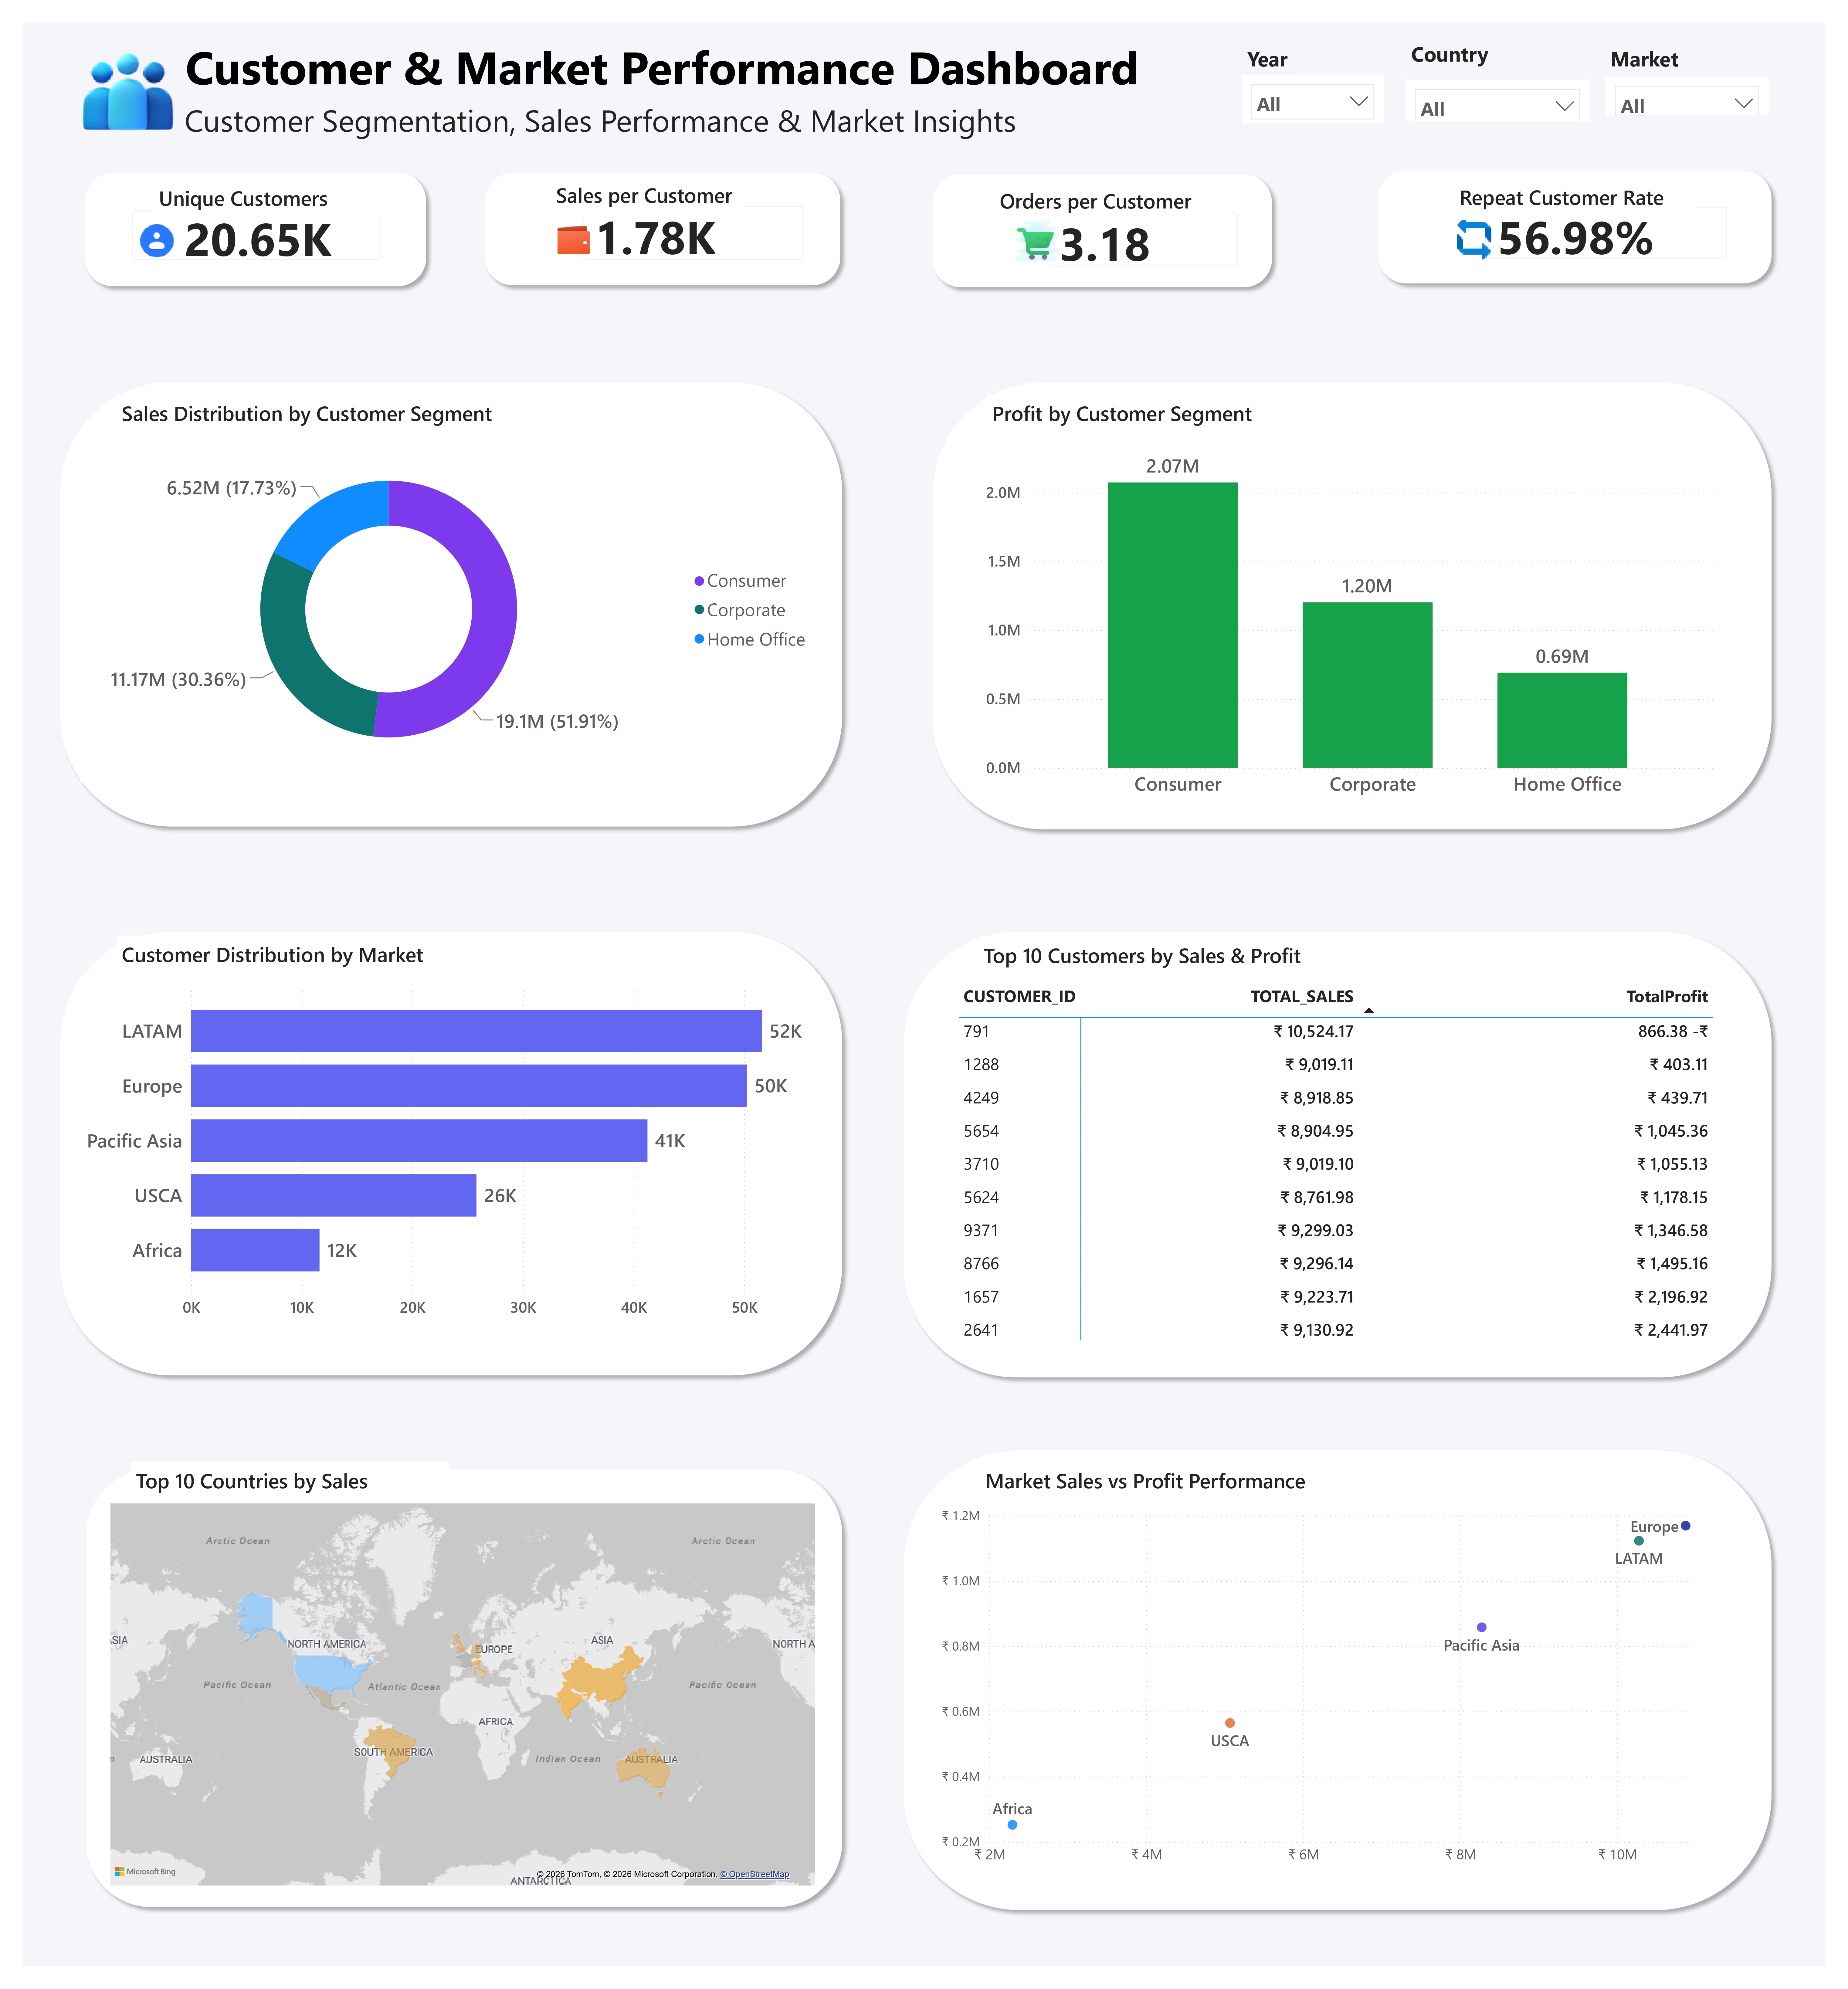
03 — Customer & Market Performance Dashboard
04 — Supply Chain & Delivery Analytics Dashboard
05 — Key Insights & Strategic Recommendations Dashboard
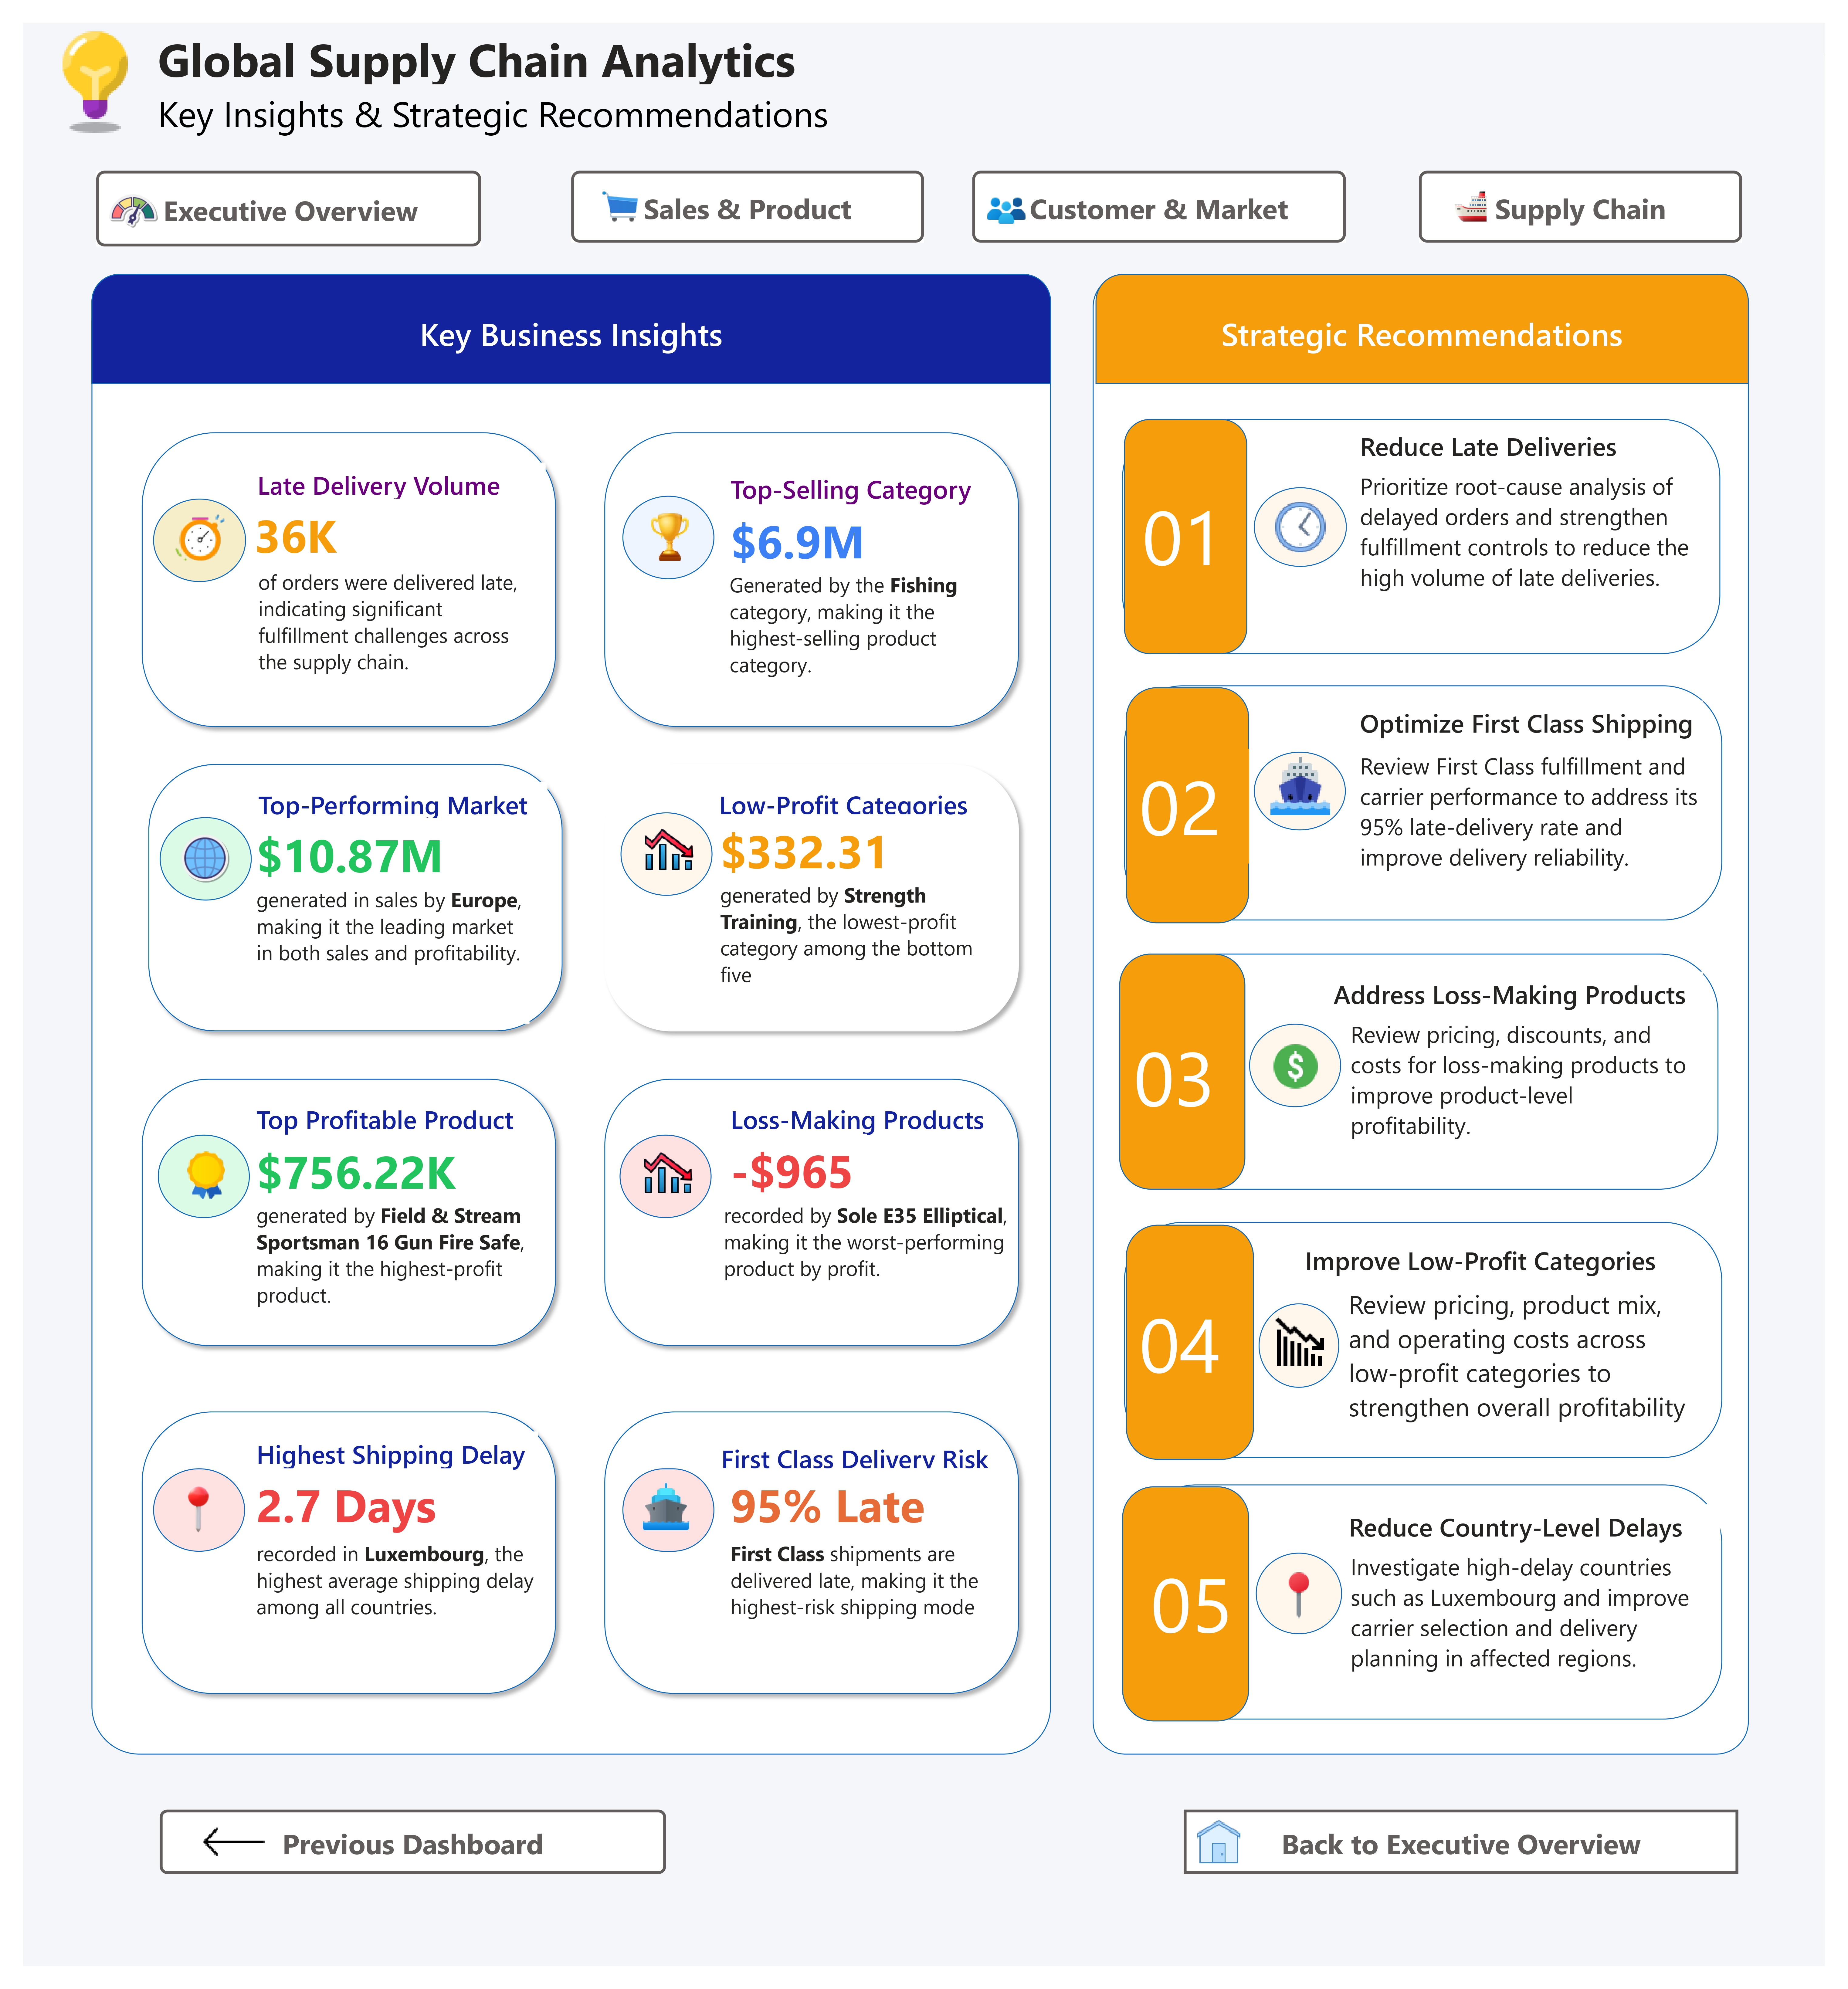
Key Insights
Sales
Evaluated total sales and revenue performance across the analyzed transactions.
Profitability
Analyzed profit generation and overall profitability using key financial KPIs.
Customers & Markets
Identified customer and market-level performance patterns and business drivers.
Supply Chain
Evaluated delivery performance, shipping delays and operational supply chain efficiency.